
Jean Brewster looks at how learners have to develop process skills to interact successfully with content. The benefits of using graphic organizers is explored with practical examples and accompanying worksheets to help you try out some of the techniques examined.
Process skills
We saw in the previous article, Thinking Skills for CLIL (follow the link at the bottom of this page), that the content a learner is studying determines the ideas, concepts, thinking and language skills that can be developed. Additionally, how the learner interacts with this content relies on the development of process skills. In science or history, for example, these include skills such as:
- Preparing for tasks: questioning, predicting and planning,
- Carrying out tasks: gathering and recording evidence by observing and using information sources, recording information/evidence (data-handling), considering evidence and changing ideas where necessary,
- Reviewing and reporting tasks: interpreting evidence and drawing conclusions, reporting and presenting, evaluating results and processes, communicating and reflecting.
Preparing for tasks: questioning and predicting
If we think of preparing for tasks, questioning is frequently mentioned in discussions of the teacher's role. It is, as Harlen and Qualter write, 'perhaps the main means of encouraging children's thinking and use of process skills' (23:2007). Eltsgeest (2001) distinguishes between productive and non-productive questions; the latter ask directly for facts or reasons with a right answer cf. Marzano's knowledge recall. The former, productive questions, are more useful in helping children's higher order thinking. This work links with de Boo's publication (1999) on open-ended questions and thinking skills. Some of these types of productive question are shown below.
Fig. 1 Questions that encourage thinking skills (adapted from Eltsgeest and de Boo)
| QUESTIONS AND THINKING SKILLS | |
|---|---|
| TYPE | PURPOSE AND EXAMPLES |
|
attention-focusing / |
to draw children's attention to things that might be missed: Have you noticed… ? What do you notice about…? |
|
comparison and contrast /
|
to draw attention to patterns, similarities or differences; to lay the foundation for classifying: What do you notice that is the same/different about these? |
|
measuring and counting |
to draw attention to quantitative/numerical comparison: How much/ long/ high/ often do you think…? |
|
action/prediction/ creative hypotheses and explanations
|
to motivate children to carry out some kind of experimental inquiry or investigation: What happens when/ if we …? |
|
problem-posing
|
to challenge learners and leave them to work something out / solve problems for themselves: Can you find out how to…? |
|
evaluation/ metacognition
|
to encourage reflective analysis: Do you think you could do it another way? |
These kinds of question not only act as examples of how the teacher can encourage higher order thinking they also model the types of question that older students can use themselves. For example, when preparing for tasks questions which encourage prediction might include:
- How do you think this could change?
- What do you think will come next?
- What will happen if we …?
Carrying out tasks: data-handling
When carrying out tasks, the recording and interpretation of evidence or data, known as data-handling, is an important stage. As we saw under comprehension in Marzano's educational taxonomy (2000), the ability to put information into categories can be encouraged by using graphic organizers, or visual representations of data. These are widely used with native speaker students since they reduce the cognitive and linguistic load for the learner, allowing them to focus on the key aspects of the ideas involved. With any search engine you will find many publications and web sites with practical examples of graphic organizers and their use at both primary and secondary levels (see e.g. Flynn, 1995 or http://www.carla.umn.edu/cobaltt/modules/strategies/gorganizers/index.html)
Graphic organizers and data handling
Graphic organizers encourage and develop key thinking skills, such as comparing and contrasting, sequencing, recognising part/whole relationships, matching cause and effect and classifying. They involve learners in active thinking about information to support clearer understanding of content lessons. There are many types of graphic organizer, such as glyphs, Venn and Carroll diagrams, tables and grids, a variety of graphs, flow charts and mind or concept maps.
These organizers show learners how information is related, rather than organized as isolated facts. Research also shows that learners are more likely to remember the content being taught when it is presented with clear colours, shapes and images. The kind of support a graphic organizer provides helps to reduce the cognitive and linguistic demands on learners so that they do not have to process so much information. This is particularly useful for students learning content in a foreign language. Thus for younger children teachers use highly concrete, visual forms based on pictures and words, such as glyphs or pictograms. Older learners move on to more abstract diagrams using words or numbers only, such as verbal types of mindmap or flowchart or graph. These models are then used by learners to practise showing how information is related, first with help, then by themselves. The final stage is when learners feel capable of carrying out data collection and choosing for themselves the most appropriate graphic organizer to represent different links between information.
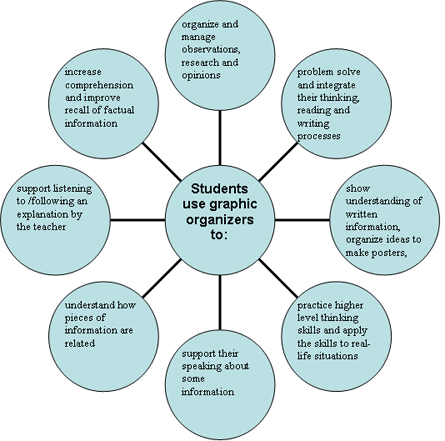
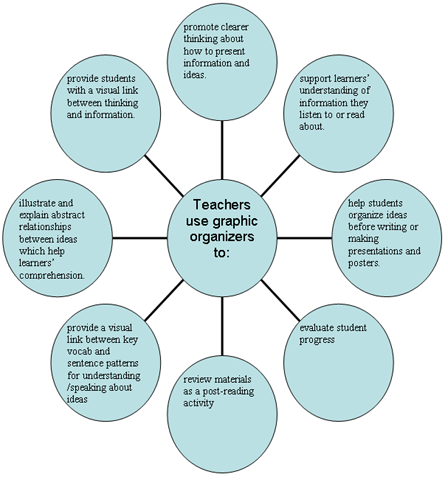
Benefits of graphic organizers for learners and teachers
The graphic organizers below show the benefits for both students and teachers.
What do teachers need to think about when using graphic organizers?
The description below shows a series of stages which teachers can think about.
- Plan a lesson activity e.g. characteristics of mammals (following on from characteristics of birds). Identify a graphic organizer which can summarize the content and show the structure of knowledge. For example, plan to use a tickchart, table or grid to highlight simple thinking skills of describing and comparing. Here the learners will be listening to and reading key words.
- Show pictures of mammals. Ask learners to talk about, or list any ideas they have. Link this where necessary to previously learned information e.g. comparing mammals with birds. Show pictures of birds and elicit ideas about how they are different from mammals. Here the learners will be listening to and speaking about key facts.
- Think of the kind of language needed for describing and comparing at the learners' level. With the key categories shown on this tick chart the teacher can go through the information, ticking each box or putting a cross as she goes. This helps learners to follow the information while they listen and read key words.
-
have beaks have limbs lay eggs feed young with milk Birds ✓ X ✓ X Mammals X ✓ X ✓
- Learners can have a similar empty template which they complete it in pairs. Learners can listen to a description with an incorrect tickchart which they correct. The teacher models /elicits key sentences and encourages children to make spokenstatements using similar patterns.
e.g. Key sentences:
Birds lay eggs.
Birds have wings but mammals don't.
Mammals have limbs and feed their young with milk but birds don't. - The teacher can then provide information on a duckbilled platypus, an unusual mammal from Australia which has a beak, webbed feet and lays eggs like a bird but feeds its young with milk. Learners then complete a tick chart for this animal. Learners can get this information through listening or reading.
-
have beaks have limbs lay eggs feed young with milk Birds ✓ X ✓ X Mammals X ✓ X ✓ Platypuses ✓ ✓ ✓ ✓
- Learners can write simple sentences about this for practice and then write true/false questions or a quiz for other students to answer.
e.g. A platypus has limbs. True or false? I'm thinking of an animal that has a beak, lays eggs and also has limbs. What is it? Do mammals feed their young with milk? Yes they do. Birds have limbs. Is this true or false? - Learners can choose a mammal or bird and draw their own tick chart, or write a short descriptive text for other children to read and complete a chart. Or they can create an imaginary creature and create a new tickchart. Here the children are integrating thinking and language skills.
Data-handling and glyphs
In my experience one type of organizer called glyphs is relatively little talked about in CLIL classrooms, so I would like to share this idea. It is probably most useful for the primary and lower high school classroom, depending on the initial picture chosen; for older students choose letters in a word or a suitable picture. Glyphs are a form of annotated picture that record information in a highly visual form. They are a particularly useful for introducing graphic organisers to children so they can practise collecting and presenting data in a motivating way. In this way they can move more easily from a concrete pictorial representation to a more abstract formulation later on.
To make a glyph use a picture or template and create a key to show how specific parts of the picture or additions to the template reveal specific information. There are at least three types of keys: picture keys, yes/no keys and if keys. For example, the key will be based on:
- Pictures and a series of simple statements from which learners chose,
- Yes/No questions or
- a series of sentences using if.
Two types of glyph
- Easy
Learners use a blank picture and discuss / read a range of options using a key. The key poses simple questions with a choice of statements attached to variations in the picture; learners select the statement that is true for them and the matching part of a drawing, either through listening or reading. For example on a picture of a bear:
Picture key
-

= I love to read 
= I like to read 
= I do not like reading
- Learners choose which statement is true for them and add appropriate eyes to the picture of the bear.
- Alternatively, the key relates to Yes/No questions. The learners read the key to annotate the drawing in different ways, for example to add different shapes, or colour parts differently to represent the answer/ data. For example, learners read statements and see if they agree or not.
Yes/No key
Bears are cool
Yes: then draw the parts of the bear labelled 1 in brown.
No: colour these parts in black.
I love to read =
-
= Yes = No -
Using these two varieties a range of pictures will be produced in different colours and with different variations; these can be 'read back' and interpreted according to the shapes and colours used.
For example:This glyph tell me that this person thinks bears are cool and likes reading.
- More difficult:
The same ideas are used but the learners have a range of instructions to follow using IF constructions. These require the same Yes/No format so that the learners add different colours, shapes etc. to the picture template and can then 'read' them back in the same way as above. For example:
If key
If you think bears are cool, colour the parts labelled 1 in brown.
If you do not, colour them black.
If bears are your favourite animal colour parts labelled 2 in yellow.
If you do not, colour them orange.
The learners can 'read' back the information a glyph provides by applying the key to say utterances like:
This glyph tells me that this person thinks bears are cool but has not chosen bears as their favourite animal (because…) .
You can download practical examples of glyphs that you can use with your classes at the bottom of this page.
Integrating three types of skill
From the examples outlined above we can see that these kinds of task do more than simply practise language skills such as reading and listening. They also develop the process skill of data-handling - collecting, recording and interpreting information - as well as a range of thinking skills.
Language skills
Learners can be:
- listening to / reading simple statements and selecting an appropriate answer;
- following spoken or written instructions;
- describing orally and interpreting what information a glyph provides;
- writing simple statements about the data given in a glyph;
- writing true/false statements about a glyph for other learners to answer;
- creating a new picture and new key for others to complete and interpret.
- creating a simple text for others to read and complete an organizer.
Lower order thinking skills
- remembering, understanding, applying, e.g. identifying, describing, naming, labelling, giving examples, summarizing.
Higher order thinking skills
- creating: students create their own glyphs e.g. planning and devising keys, writing quizzes.
Process skills
- collecting data, using a key, presenting/interpreting information;
- getting ideas, creating a text, making a key and devising appropriate questions for others to interpret.
When you are planning lessons it may be easy for you to analyse the language demands and goals of learning but you may not have considered what kinds of thinking is required and what kinds of processes the learners could be developing. Now may be a good time to experiment.
References
de Boo, M. (1999). Enquiring Children, Challenging Teaching. Buckingham:Open University Press.
Elstgeest, J. (2001). 'The right question at the right time.' In W. Harlen (ed.) Primary Science: Taking the Plunge. 2nd edn, Portsmouth. N.H.: Heinemann.
Flynn, K. (1995). Graphic organizers… helping children think visually. Cypress, CA: Creative Teaching Press Inc.
Marzano, R. J. (2000). Designing a new taxonomy of educational objectives. Thousand Oaks, CA.: Corwin Press.
Downloads
Click link to download and view these filesProcess skills: Glyphs: Maths 1
PDF, Size 0.25 mbProcess skills: Glyphs: Maths 2
PDF, Size 0.23 mb
Study skills for CLIL

This series explores study skills that equip students when learning curriculum subjects through the medium of English. Cognitive, academic, thinking and process skills are developed alongside language skills in the CLIL classroom, providing students with life-long learning skills. This series of articles and practical examples will help you to incorporate ...
- 1
- 2
- Currently reading
Process skills and data-handling for CLIL
- 4
- 5
- 6


No comments yet