
Some top tips, a lesson plan and a student worksheet about describing data-line graphs to help with the writing component of the IELTS exam.
Example question
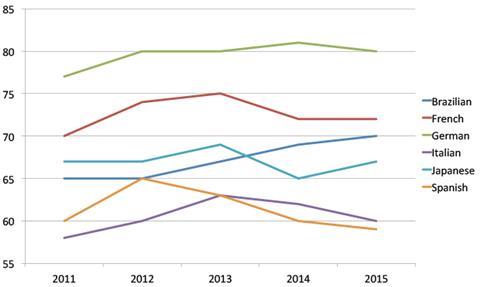
The graph below shows the pass marks for different nationalities of students over the last five years. Write a report for a university lecturer describing the information shown below.
Teacher's tips
Tip 1: The data that the students must describe is given in a graphic form (e.g. a graph or bar chart) or as a table of figures.
Tip 2: Students have to write 150 words in 20 minutes, in well organised paragraphs, with a conclusion - so time is of the essence! All class work should be closely timed, be it brainstorming, discussion or actual writing.
Tip 3: Tenses they are likely to need to know for this part are the contrast between present perfect for unfinished actions and the simple past, the use of present continuous to describe things in the process of happening, and future with will for predictions.
Tip 4: The other language they are likely to need is that of trends. A great source for this is Business English teaching books.
Tip 5: The thing students most often forget, and the obvious way to start the piece of writing is to describe what the graph actually represents:This graph shows.../ the axes represent....
Tip 6: The obvious way to liven up classes practising this point is to speak about the graphs before writing about them. It is possible to play games like pairwork information gap activities and Bingo to add a bit more fun.
Tip 7: The other way to add interest for the students is to use data that means something to them personally,e.g. graphs from local government or newspapers, or having them give presentations on something that interests them.
You can download the worksheets and lesson plan below.
Answer key for student worksheet exercise 2
- 1
- 2
- 3
- 4
- 5
- 6
- 7
- 8
- 9
- 10
- 11
- 12
- 13
Downloads
Click link to download and view these filesdescribing data line graphs lesson plan
PDF, Size 72.01 kbdescribing data line graphs student worksheet
PDF, Size 68.13 kb
IELTS: Writing
Help dealing with the writing component of the IELTS exam.
- 1
- 2
- Currently reading
IELTS: Describing data-line graphs 1
- 4
- 5
- 6
- 7
- 8
- 9
- 10
- 11
- 12
- 13
- 14
- 15
- 16
- 17
- 18
- 19
- 20
- 21
- 22
- 23


No comments yet